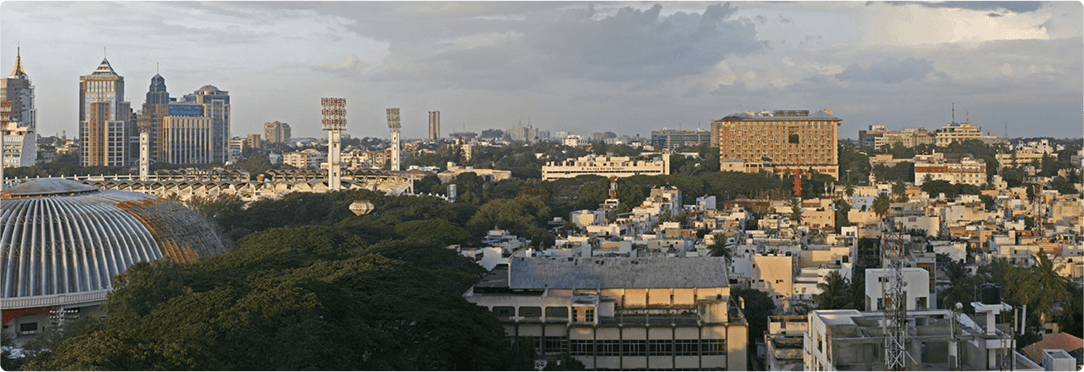
Introduction
In today's rapidly urbanizing world, cities are grappling with congestion, fragmented services, and outdated systems. Honeywell's Smart Cities initiative emerged as a visionary response — a research-driven project that evolved into a set of high-level wireframes, designed to seamlessly integrate urban operations.
This case study chronicles the journey from in-depth research to conceptual design, demonstrating how strategic UX can transform city management for a smarter, safer, and more sustainable urban future.
The Urban Challenge — Unpacking Complexity
Before designing a smarter interface, it was crucial to define the problem. Urban environments today are plagued by fragmented digital services that do not fully engage or inform citizens.
Fragmented Urban Operations
Cities have long suffered from disjointed systems where departments work in silos. From waste management to traffic monitoring, the lack of integration resulted in slow response times and inefficient service delivery.
Interdepartmental Coordination Issues
Municipal teams struggled with communication hurdles — manual processes, language barriers, and inadequate digital tools created gaps leading to delays and operational errors.
Citizen Engagement and Operational Gaps
Residents were left with no centralized platform to report issues or track progress — a decrease in trust and satisfaction, with critical urban challenges going unaddressed.
Project Goals
Create an integrated, real-time command center.
Enhance incident management across domains such as traffic, waste, water, and lighting.
Foster seamless interdepartmental coordination and citizen engagement.
Leverage advanced analytics to improve operational efficiency.
"How can technology transform everyday urban experiences into smart, seamless, and engaging interactions?"
Research & Discovery
Phase 01 — Primary Research · Field Observations (10-day period noting citizen navigation and kiosk interactions) · User Interviews (city residents, public service users, urban planners) · Usability Testing (early prototypes in real-life settings).
Phase 02 — Secondary Research · Literature & Benchmarking (existing urban digital interface studies) · Data Analysis (quantitative metrics validating observational insights).
Existing Solutions
Existing Solutions & Implementations
Honeywell's current solution is a robust, integrated command console already being deployed:
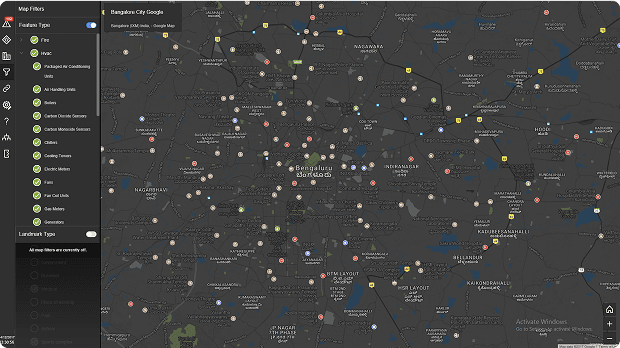
GIS Maps
- Load multiple layers
- Provide search capabilities
- Nearby elements/cameras/sensors search
- Third-party map integration
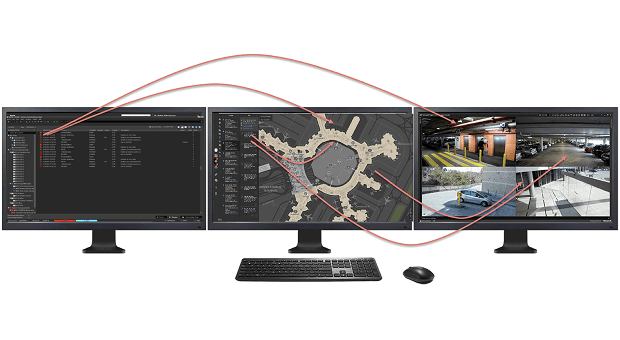
Orchestration
- Navigate seamlessly through different screens
- Track an incident on the map using DVM and viz.
- Search for nearby cameras
- From incident, see map location and associated videos
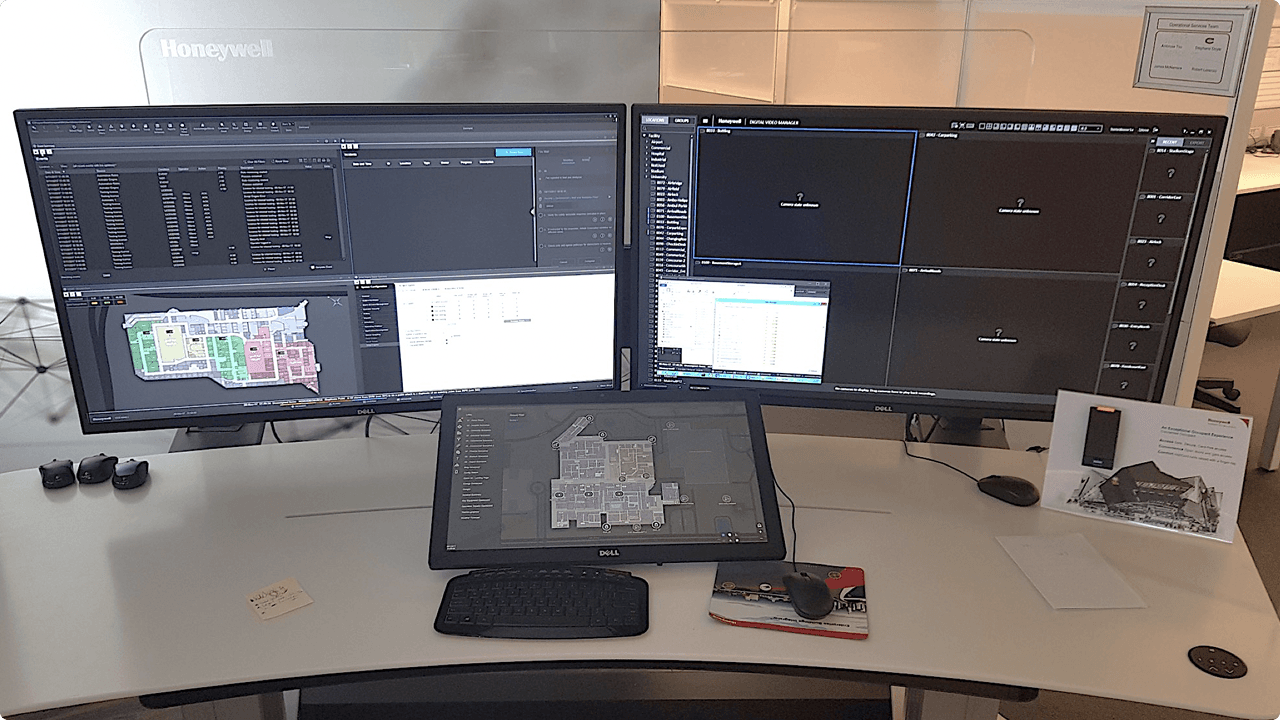
Command Console — collaboration between HUE Bangalore and HUE Sydney
User Research
Mapping the Journey — Deep Dive into User Research
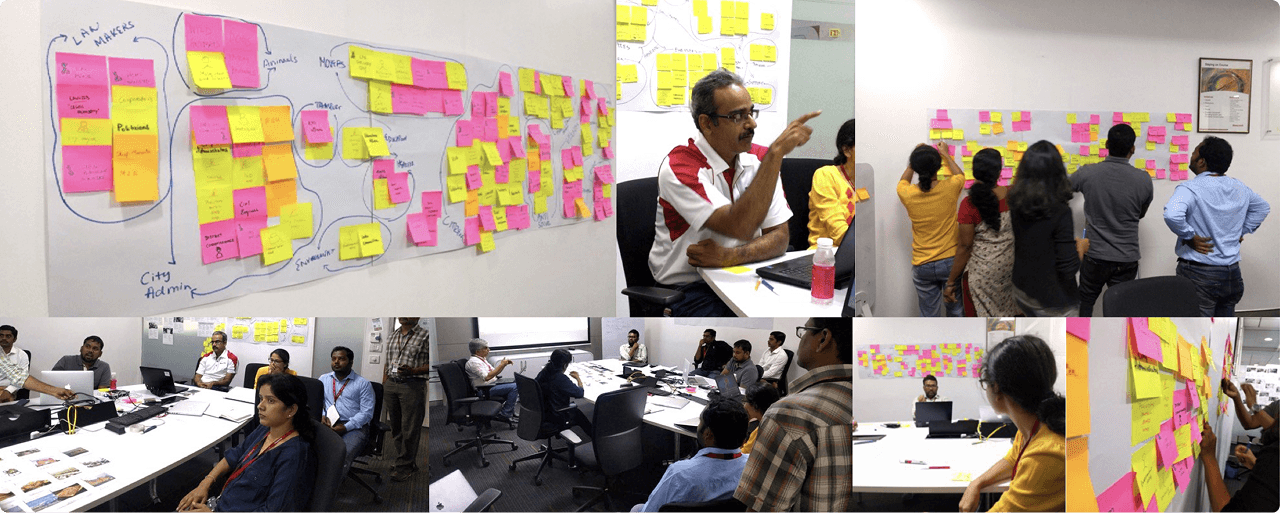
VOC & OVOC studies — interviews with municipal officials and control room operators
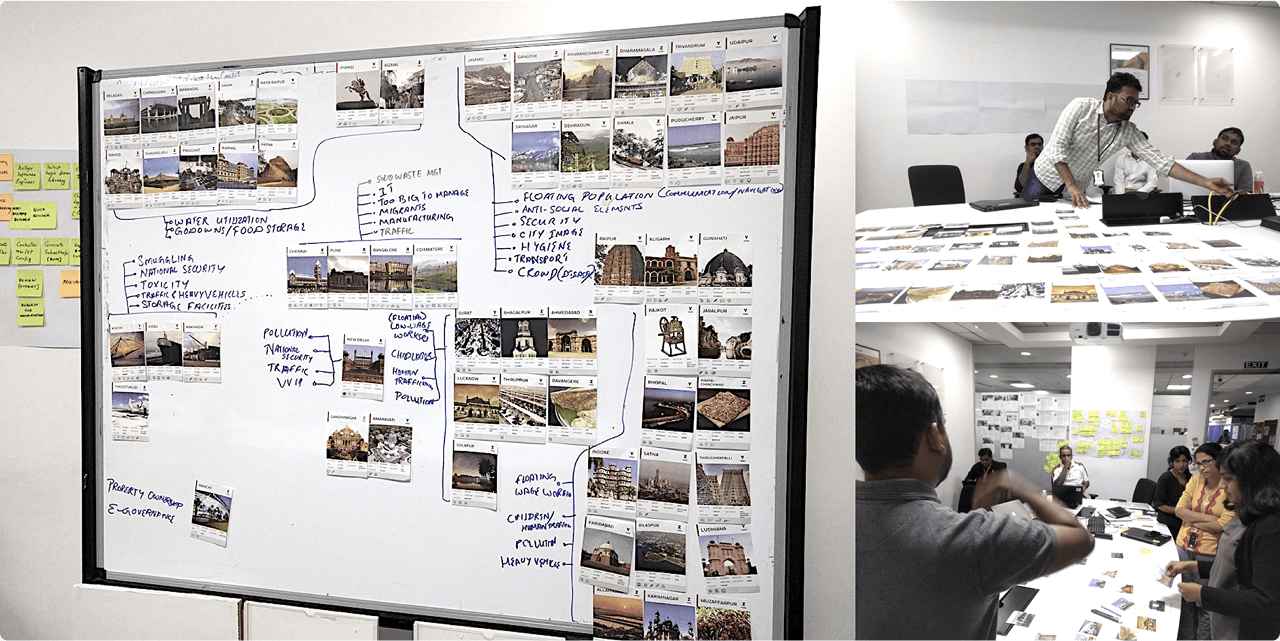
Workshops & field studies mapping urban complexities
Key Insights
Unified Communication is Critical The lack of integrated tools significantly delayed incident response.
Localized Urban Challenges Detailed city mapping revealed that each urban area has unique infrastructure issues requiring bespoke solutions.
Need for Real-Time Data Stakeholders emphasized the importance of real-time data visualization and predictive analytics.
Citizen Engagement A centralized platform for reporting and resolving issues is vital for restoring public trust.
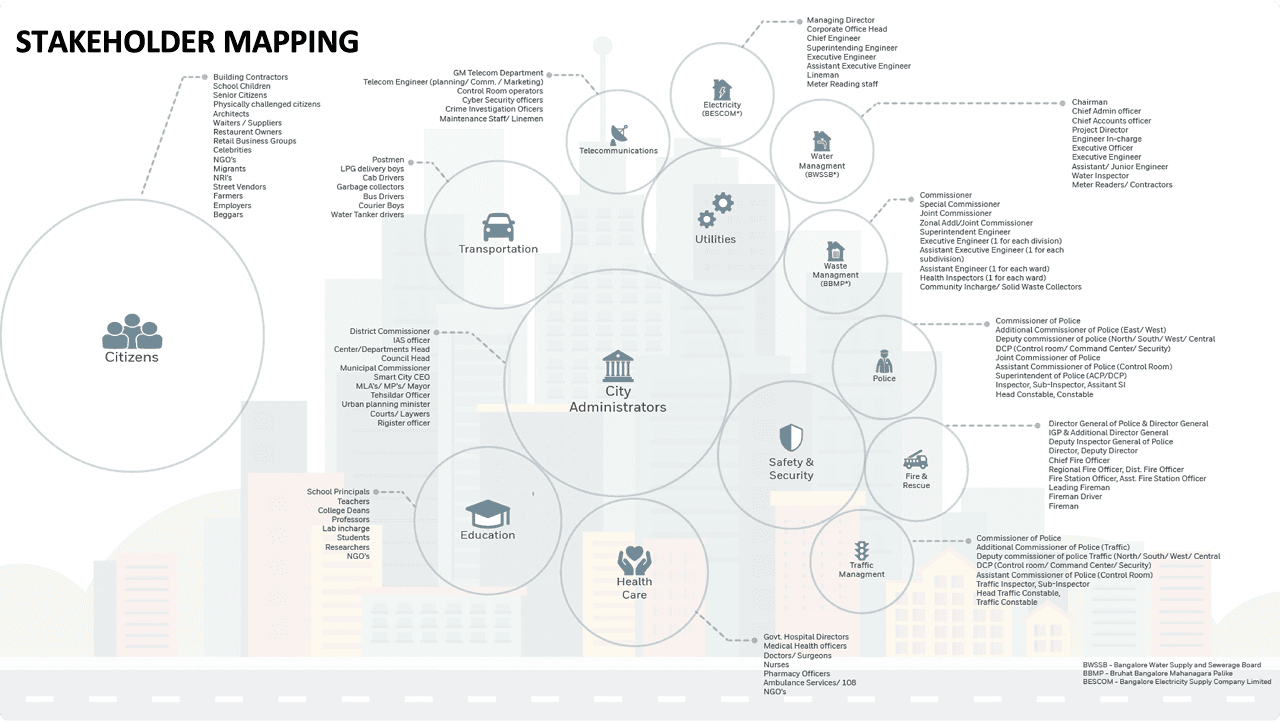
Stakeholder mapping — connecting municipal officials, operators, and field engineers
Challenges Faced and Pain Points
Fragmented Operations Disconnected systems resulted in slow, error-prone responses.
Language & Tech Barriers Many operators found current systems cumbersome due to language challenges.
Manual Tracking Reliance on legacy systems and manual entry led to inefficiencies.
Citizen Disengagement The absence of a unified platform left residents frustrated and disconnected.
Limited Real-Time Visibility Inadequate data access hampered quick decision-making.
India Context
Understanding Indian Cities — A Tapestry of Diversity
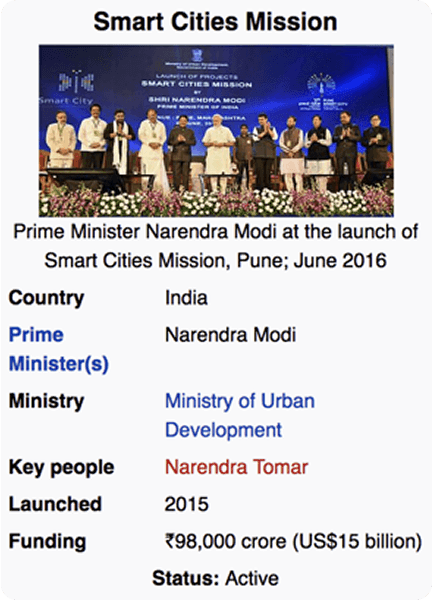
The India Smart Cities Mission aims to transform 100 cities into citizen-friendly, sustainable urban hubs — this initiative provided the backdrop for our research.
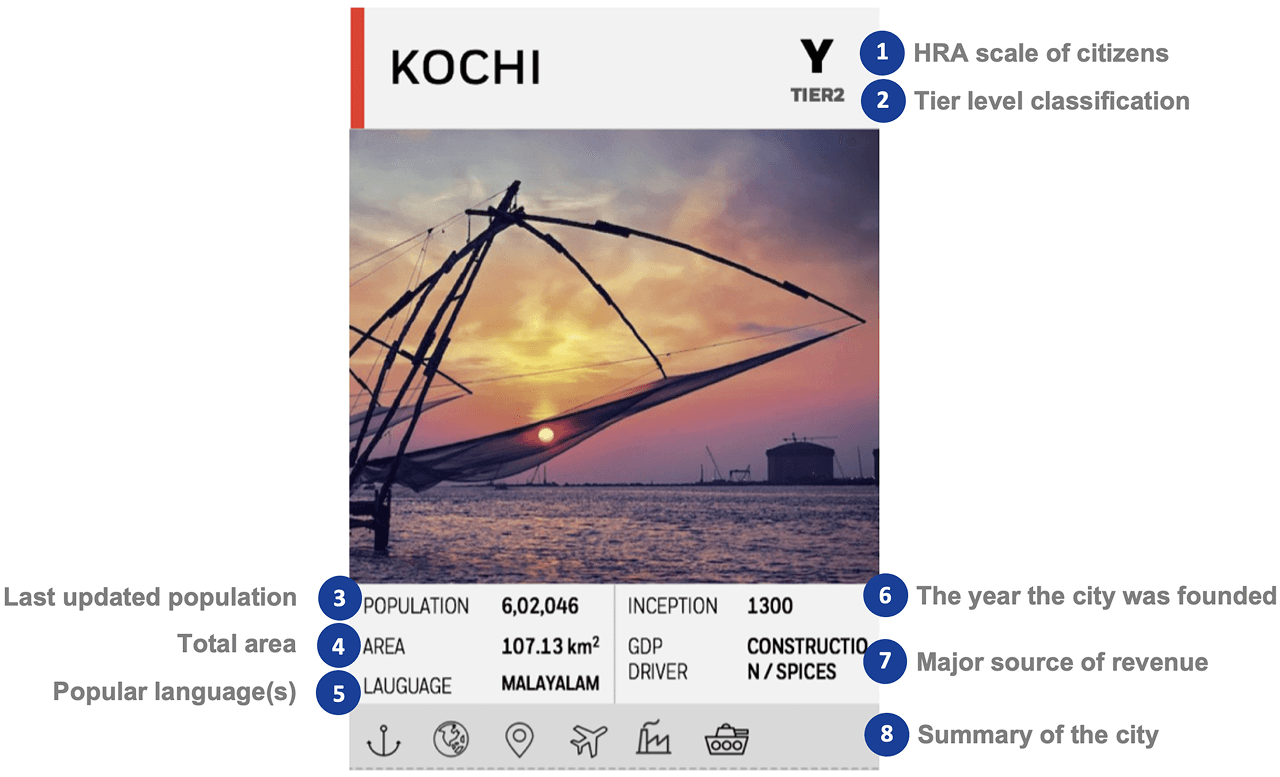
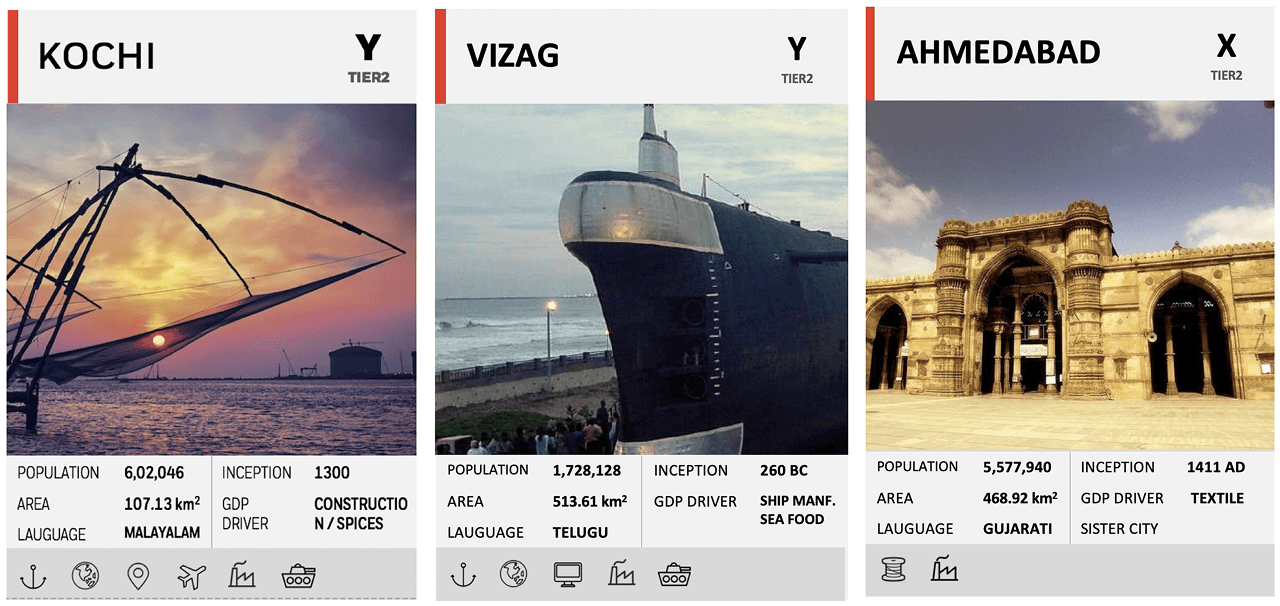
City profiles — each Indian city's unique demographic and economic context informed tailored solutions
City Profiles
Detailed profiles (e.g., Vizag's ancient legacy vs. Ahmedabad's industrial might) highlighted varied challenges and opportunities.
Economic & Cultural Context
Each city's unique demographic, economic drivers, and cultural nuances informed tailored smart solutions.
Workshops & Stakeholder Engagement
Collaborative sessions with local authorities showed the need for localized, scalable tech that respects each city's distinct identity.
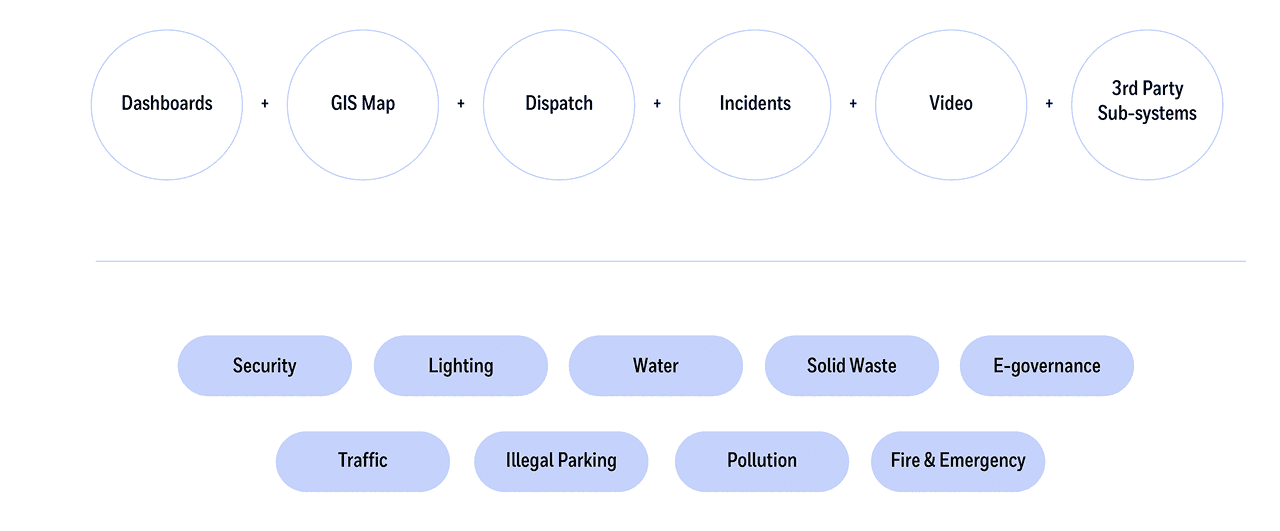
What our cities are asking for — highlights from research synthesis
Competitor Analysis
To design an effective solution, we conducted a series of interviews with stakeholders and analysed what others are doing across key capability areas.
| Feature | IBM IOC | Trinity ICCC | Our Design |
|---|---|---|---|
| Incident Management | |||
| Workflow customisation | ✓ | ✓ | ✓+ |
| Dispatch to field teams | ✓ | ✓ | ✓ |
| Collaboration with response teams | ✓ | ✓ | ✓+ |
| Dashboards & Analytics | |||
| Operational dashboards with drill-down | ✓ | ✓ | ✓+ |
| Emergency responders readiness | ✓ | ✗ | ✓ |
| KPI monitoring and incident heat maps | ✓ | ✗ | ✓+ |
| Citizen Interactions | |||
| Grievance redressal | ✓ | ✓ | ✓+ |
| Citizen broadcasts | ✓ | ✓ | ✓ |
| Deployment | |||
| Cloud & on-premise options | ✓ | ✓ | ✓ |
User Personas
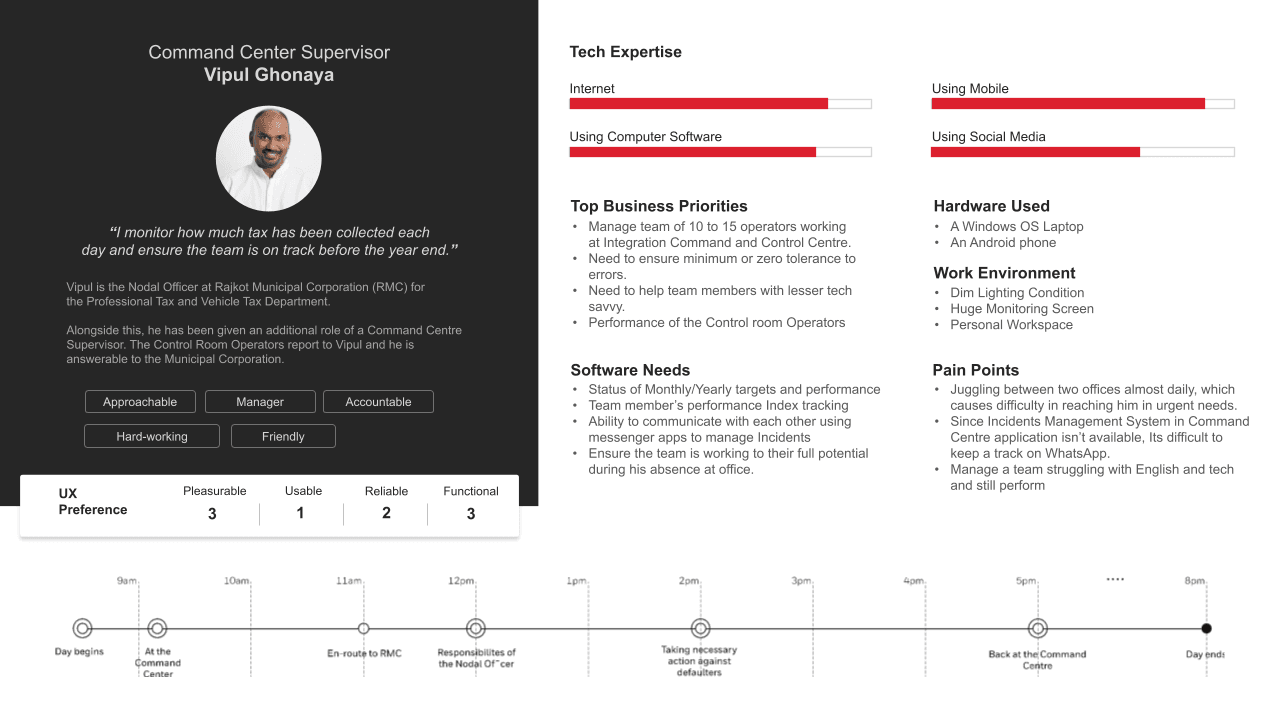
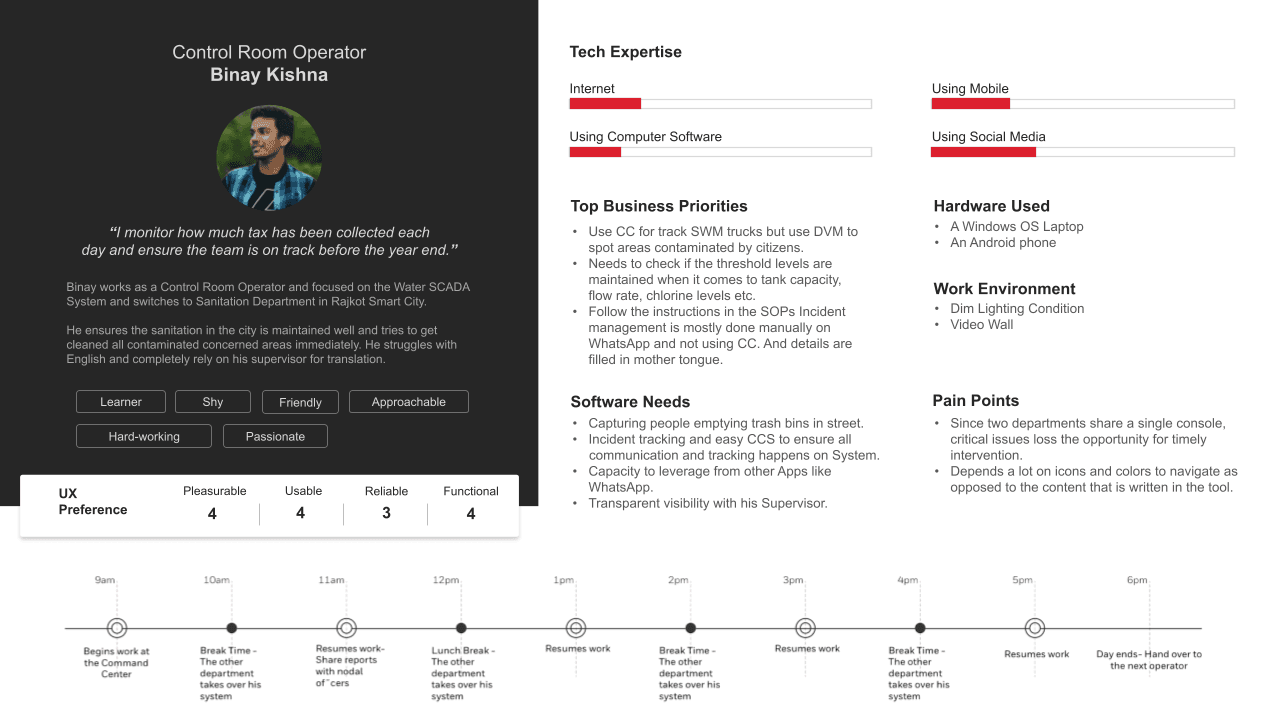
Primary persona — City Operations Manager
Primary persona — Field Engineer
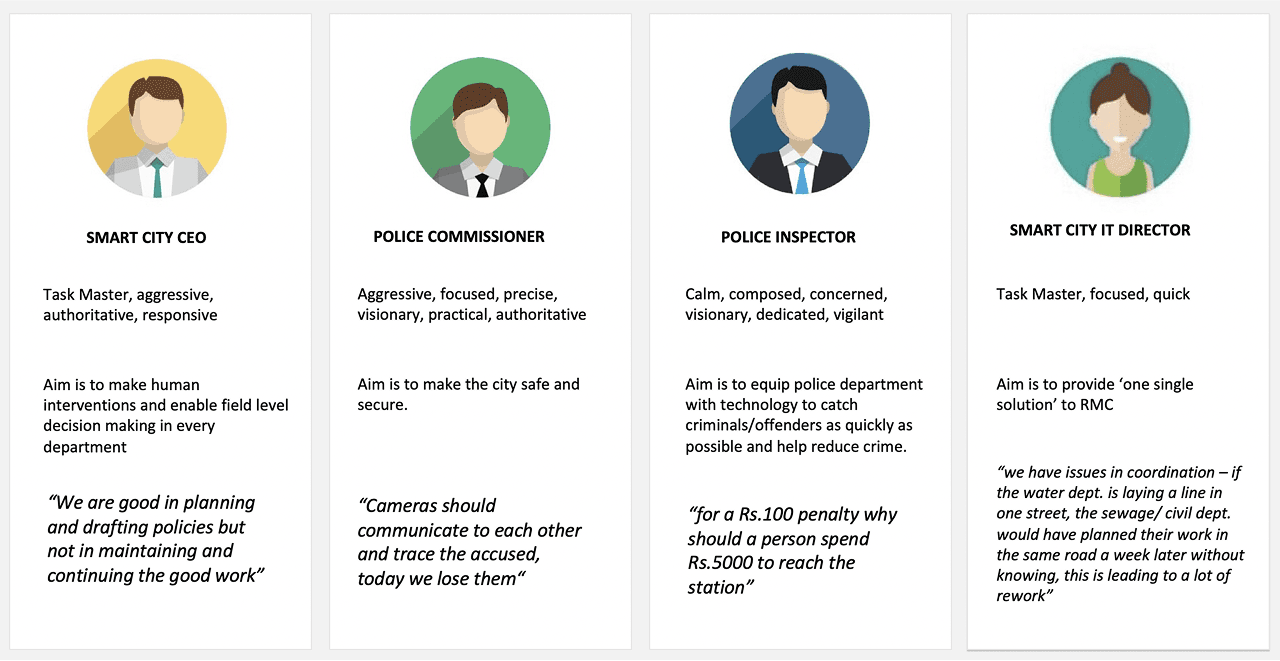
Secondary personas — Citizen, Department Head, City Administrator
Ideation and Conceptualization
“As-Is” vs. “To-Be” journey maps illustrate the transformative potential of the Smart Cities platform, capturing three key workflows:
Journey maps cover
Incident Response From initial alerts to dispatch and resolution.
Citizen Engagement Transitioning from fragmented, manual reporting to an integrated digital platform.
Operational Workflow The shift from disjointed processes to seamless, real-time management.
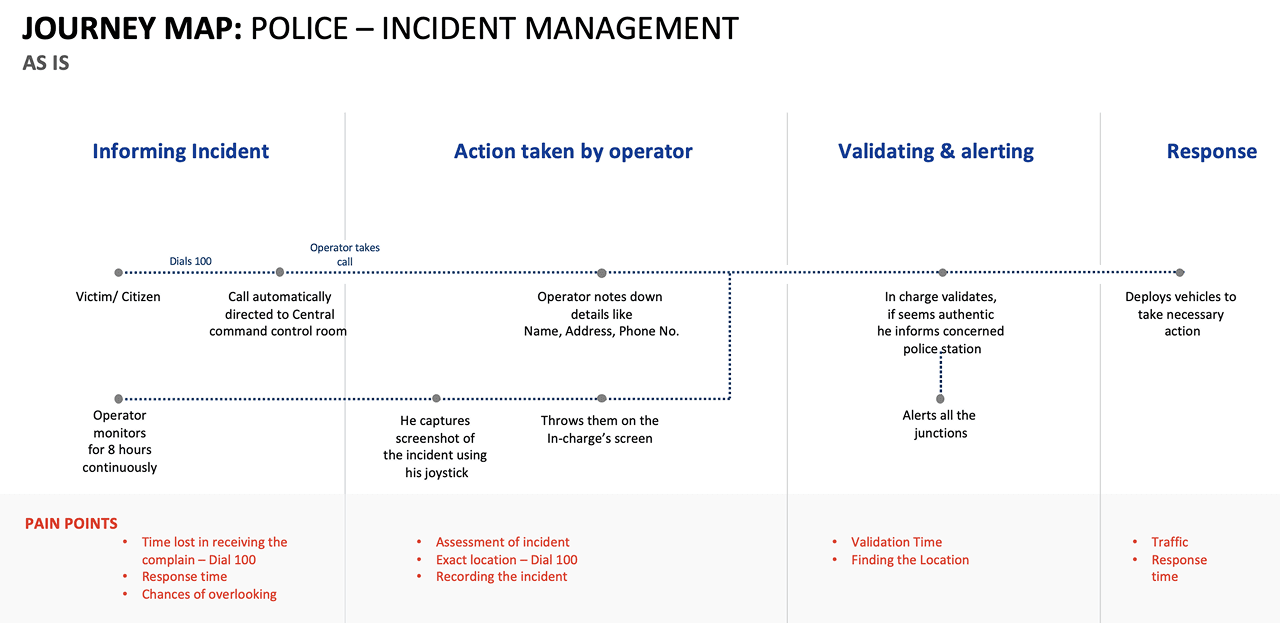
As-Is journey map — current incident response workflow
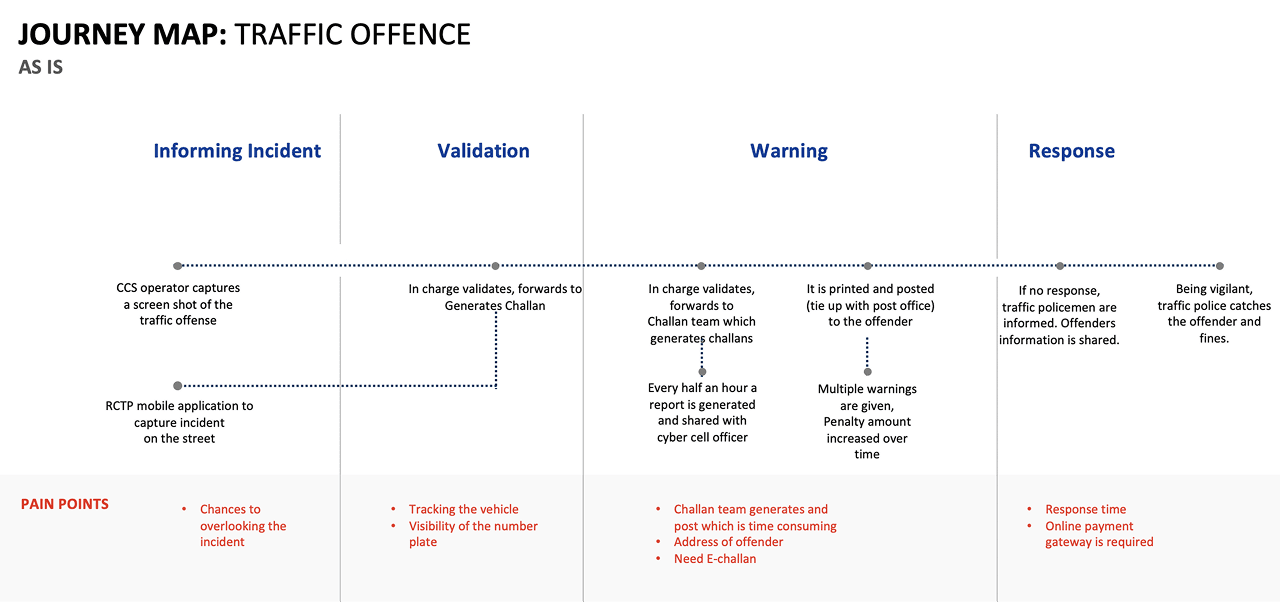
As-Is journey map — citizen engagement and service delivery
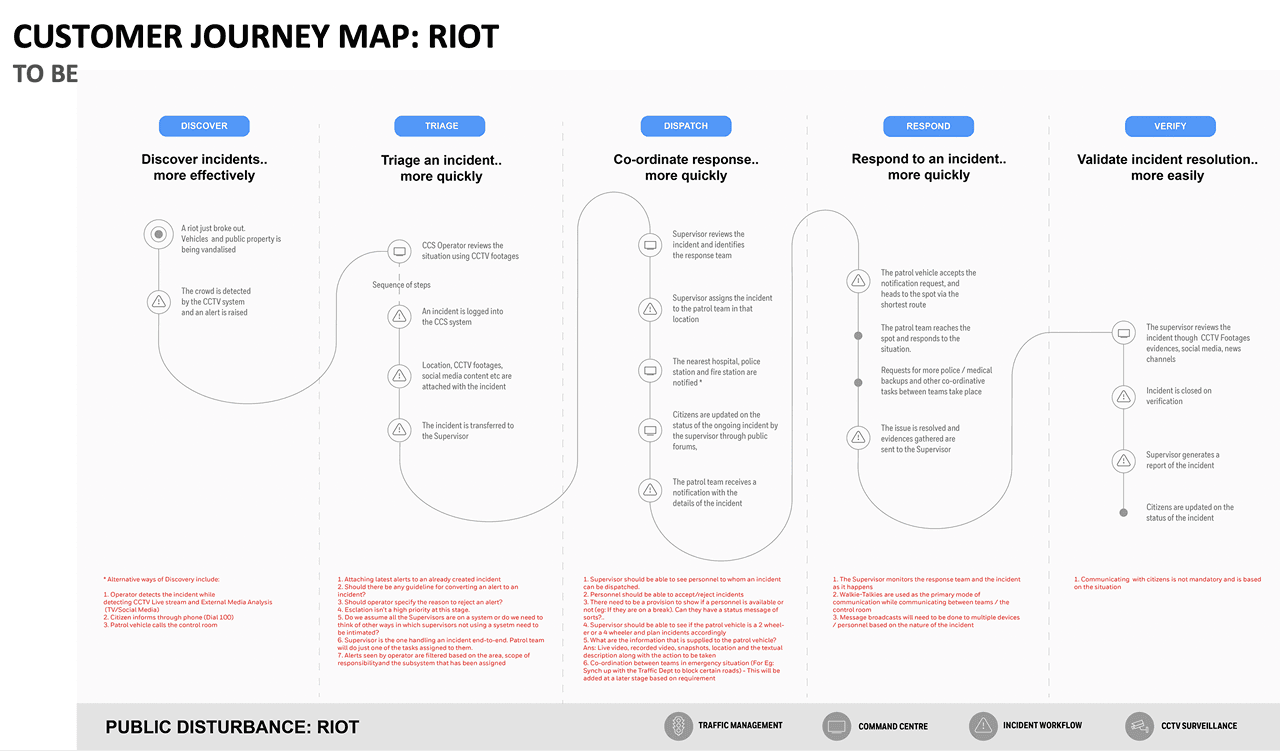
To-Be journey map — integrated incident response
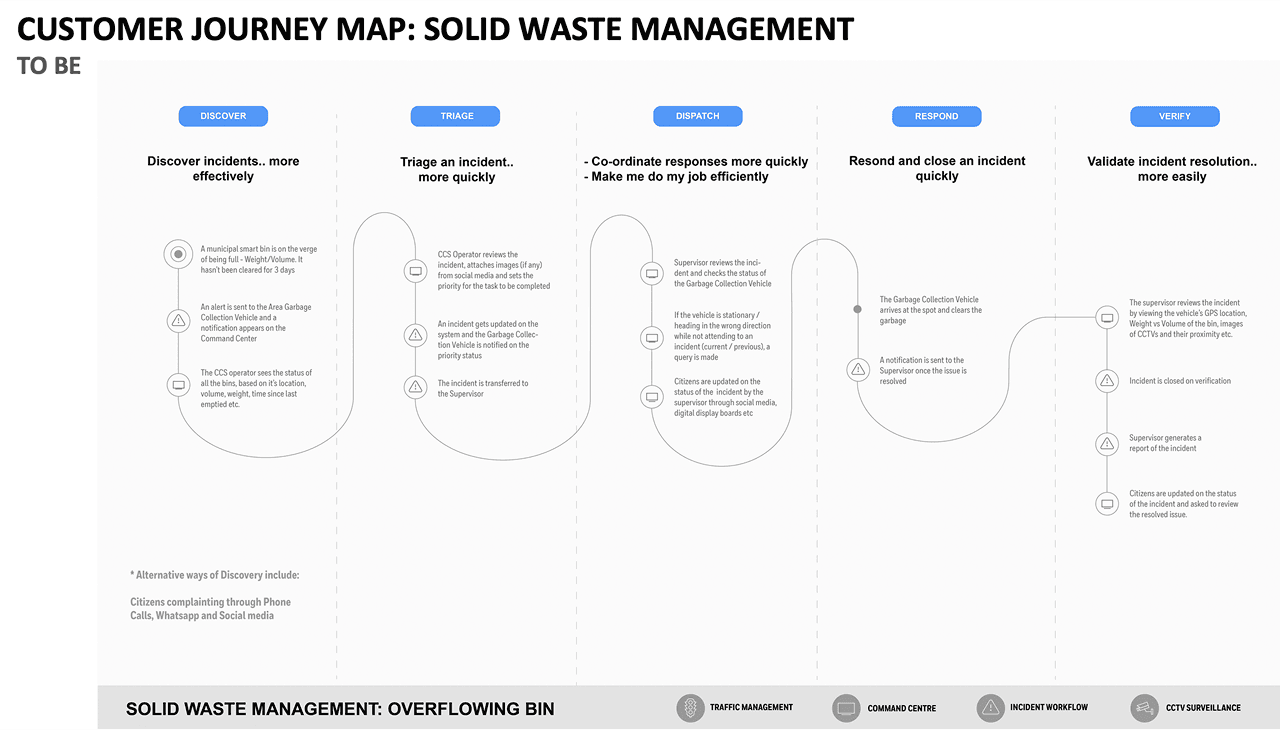
To-Be journey map — seamless citizen engagement
CEO Dashboard
Designing for Smart City CEO's Dashboard
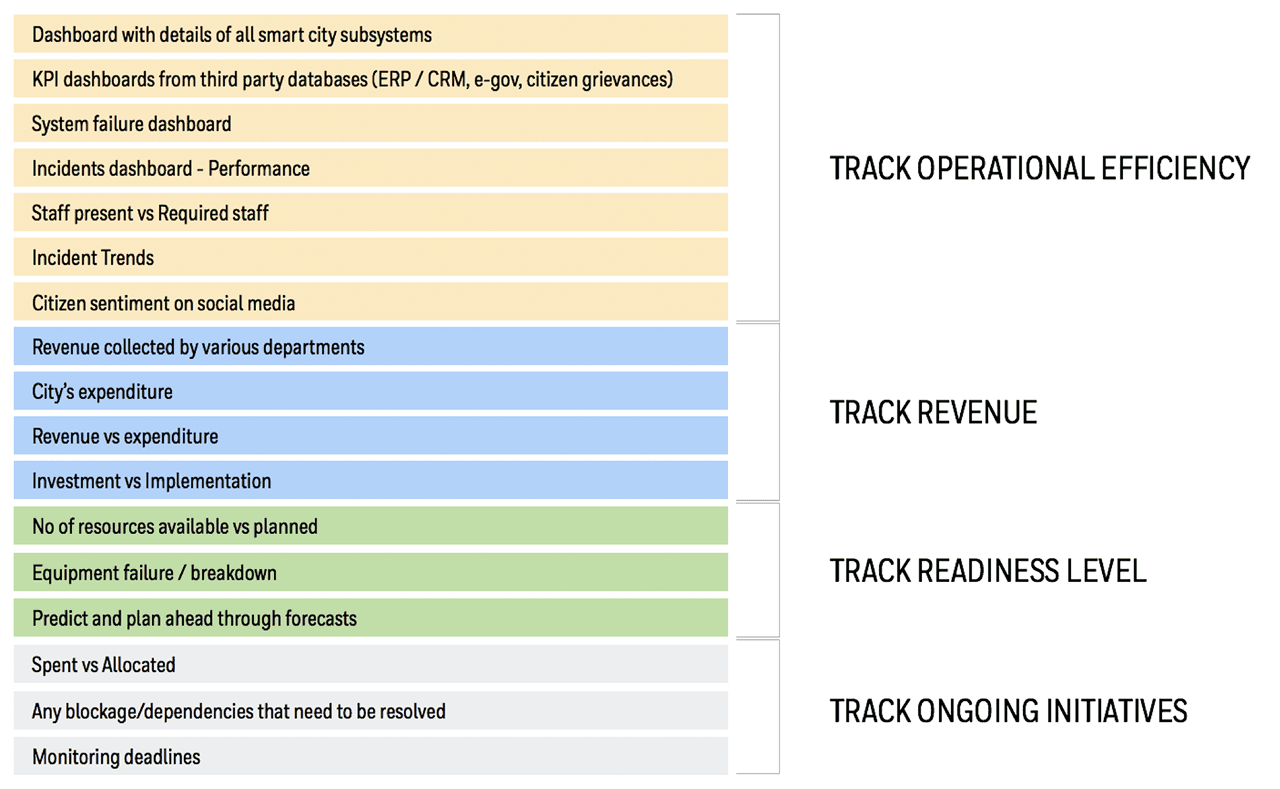
CEO Dashboard wireframe — city-wide operational overview
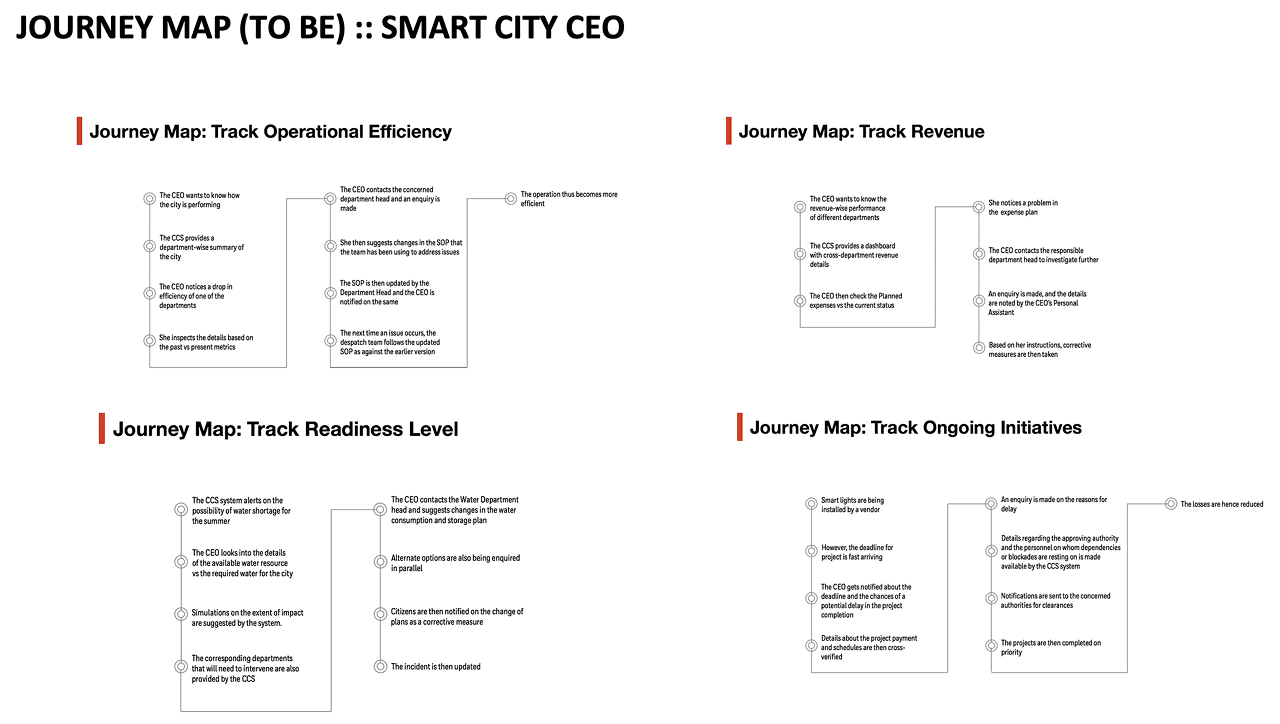
CEO Dashboard journey map — from city alerts to executive decision
High-Level Wireframes & UX Conceptualization
The objective was to create high-level wireframes capturing:
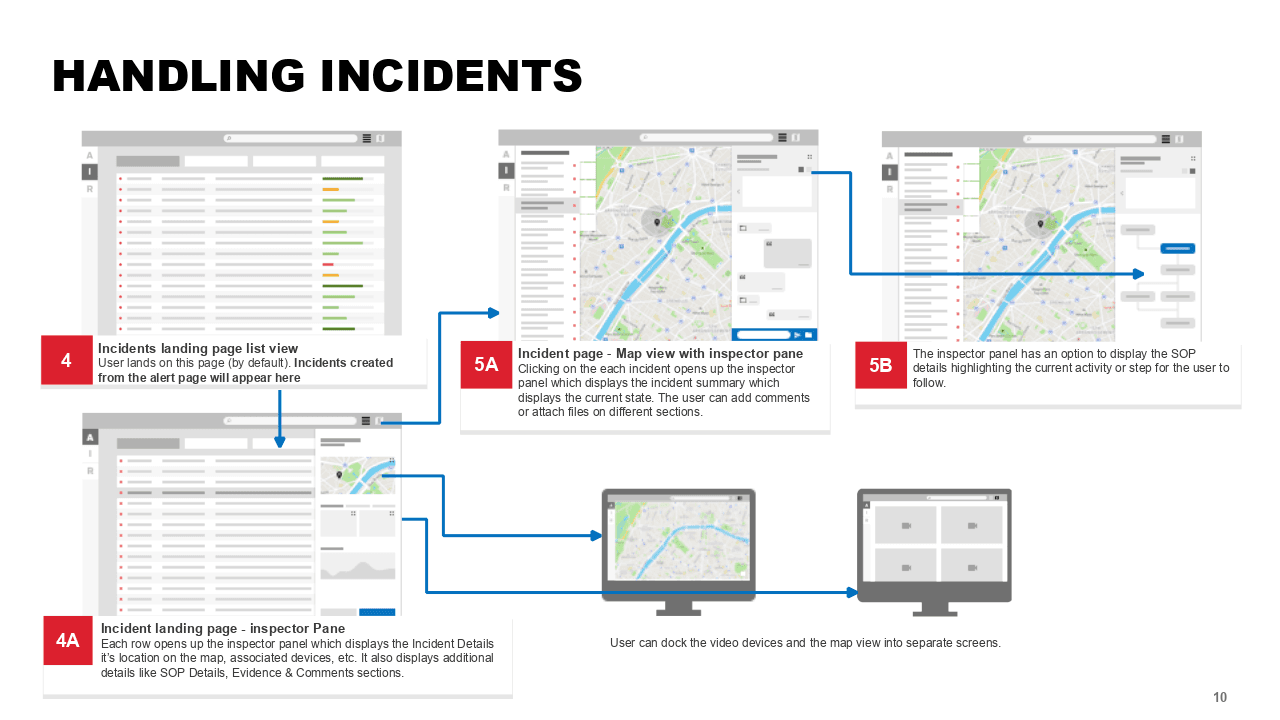
Alerts Landing Page Dual views (map and list) for quick incident assessment.
Incident Details Panel Visual breakdown of incident specifics, SOP guidance, and communication channels.
User Interaction Flows Detailed user journeys from alert reception to incident closure.
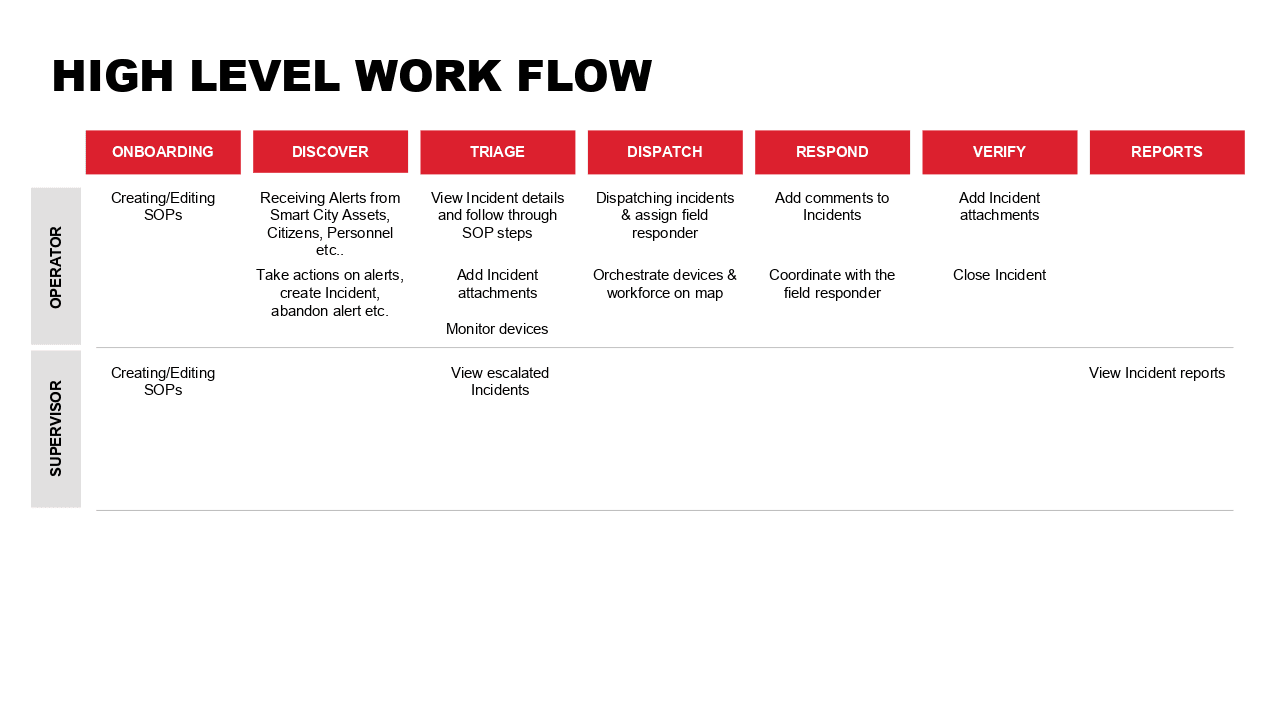
High-level workflow wireframes — alert listing views
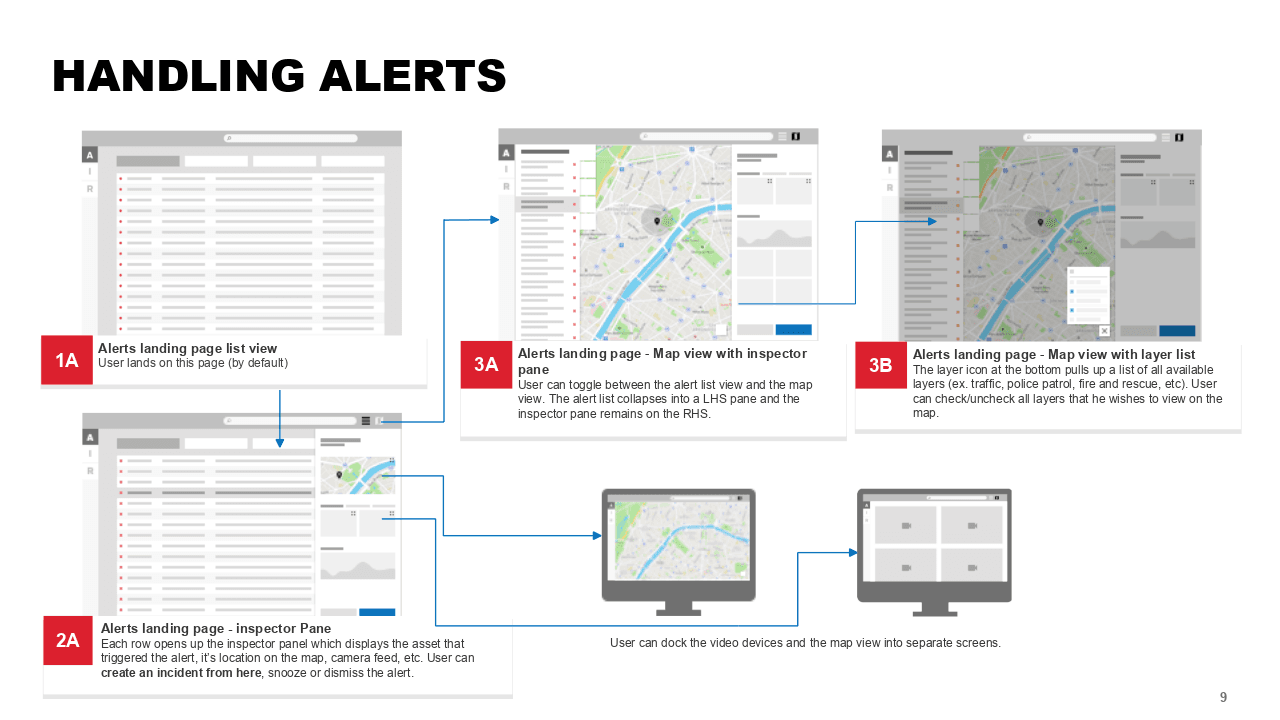
High-level workflow wireframes — incident management flow
High-level workflow wireframes — SOP designer canvas
High-level workflow wireframes — multi-screen dashboard layout
New Concepts
New Concepts and Innovations
Advanced SOP Designer
An intuitive, visual canvas allows users to create and modify Standard Operating Procedures through block-diagram representations. Auto-connected activity cards and if-else conditions simplify workflow creation, reducing errors and training time.
Enhanced Multi-Screen Functionality
New wireframes illustrate the capability to separate video feeds and maps across different screens. This multi-screen approach enables operators to monitor various data streams simultaneously, boosting situational awareness.
Refined Incident Detail Panels
Redesigned layouts offer richer, more accessible details — including comprehensive SOP information, evidence attachments, and real-time commentary — ensuring users can respond more effectively.
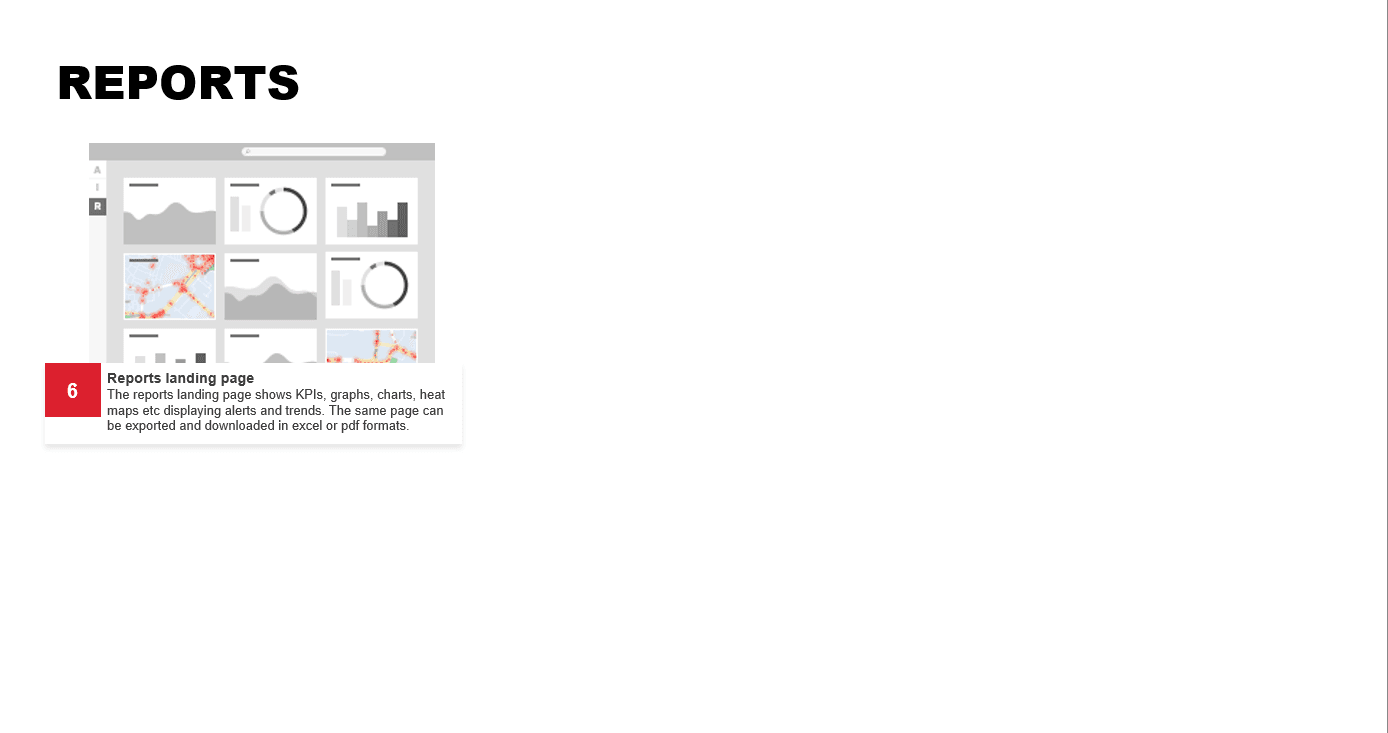
Interactive & Customizable Dashboards
The updated interface supports dynamic layering and filtering, allowing users to tailor the display to operational needs. Enhanced iconography, colour coding, and visual cues improve navigation and reduce cognitive load.
Task-Based Design Enhancements
Focused on intuitive interaction, these innovations emphasize ease-of-use through clear visual hierarchies and customizable views, enhancing the overall user experience.
Execution Details — Phased Rollout
UX and Technology Integration
Real-Time Analytics Leverages IoT sensors and AI-driven insights for predictive analytics and rapid decision-making.
Collaborative Tools Integrated communication channels foster seamless coordination among departments.
Citizen-Centric Interface Empowers residents to report issues and stay informed through an engaging, user-friendly portal.
Phase 1
Alert Listing and Details
Discover city alerts — easily.
Before
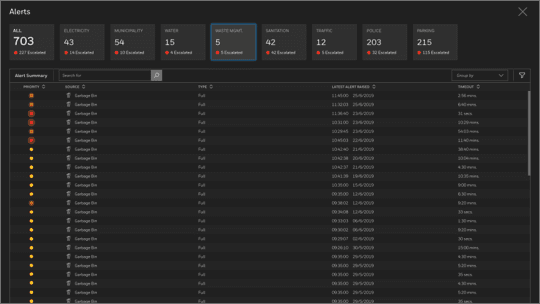
Alert Listing — tabular format with Priority, Source, Type, Date & Time, Timeout columns
After
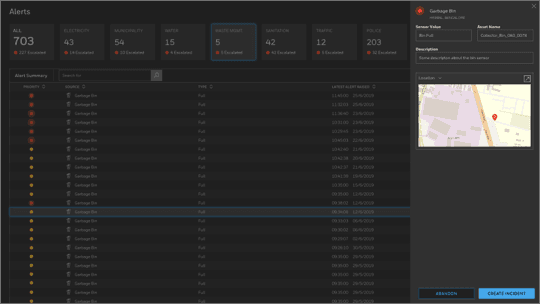
Alert Details — right panel with location sub-section that can pop-out to a second screen
Phase 2
Incidents Listing and Details
Act on smart city alerts — quickly.
Before
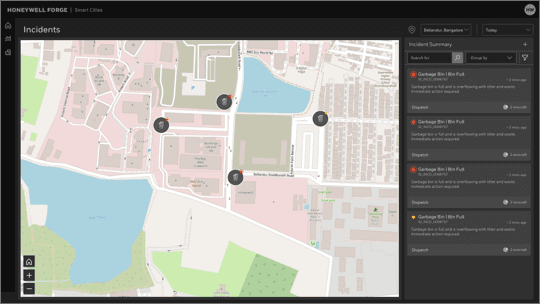
Incidents Listing — card list alongside live map, incidents highlighted with source icons
After
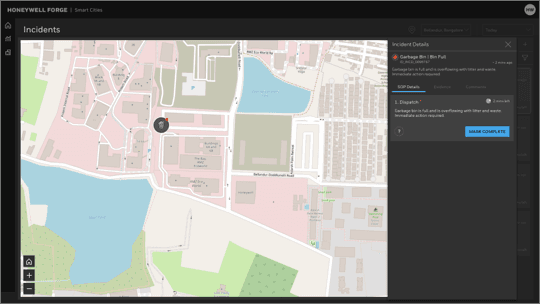
Incident Details — overlay panel with SOP details, evidence, and comments sections
Phase 3
SOP Designer
SOP Designer Canvas
The SOP Designer consists of a canvas and config panel. The canvas can be visualized in block diagram form and the config panel provides contextual actions to create the flow.
If-Else Condition
An if-else condition can be added between two cards by invoking the action via the plus '+' sign — enabling complex conditional workflows.
Creating a SOP Activity
SOP creation starts by clicking 'Start Creating SOP' which provides options for adding an activity. Each activity card shows a '+' sign to automatically add and connect the next activity.
Before
SOP canvas — block diagram representation of the workflow
After
SOP config panel — contextual actions to create and link activities
Impact, Reflections and the Road Ahead
Reduced Response Time
Incident response improved from hours to mere minutes.
Operational Efficiency
Streamlined processes reduced manual effort and cross-team errors.
Enhanced Collaboration
Integrated communication channels fostered better interdepartmental coordination.
Citizen Satisfaction
Direct citizen engagement channels bolstered trust and transparency.
Conclusion — A Vision Realized Through Thoughtful Design
“Honeywell's Smart Cities initiative stands as a powerful example of how in-depth research and visionary design can converge to create transformative urban solutions.”
By addressing the intricacies of urban challenges and crafting a user-centric interface, this project not only enhances operational efficiency but also redefines the citizen experience. The journey from comprehensive research to high-level wireframes demonstrates the profound impact that thoughtful UX can have on shaping the cities of tomorrow.